For example, storing foods above their softening transition may result in faster rates of degradation, and in lyophilisation, primary drying above the glass transition can result in collapsed cakes. On the other side of optimisation, operating at lower temperatures than is required leads to longer processing times, and thus inefficiency; having detailed and clear analysis data allows the determination of clear parameters that increases efficiency and productivity.
What is the Lyotherm and how can it help?
The Lyotherm is a unique combination of an emerging analytical technique, impedance analysis, combined with traditional differential thermal analysis (DTA). These techniques use two different perspectives to enhance the analysis data providing an extra dimension to the information allowing for greater detail and more informed decision making.
Electrical Impedance: Impedance combines capacitance, inductance and resistance into one metric that relates to molecular mobility within the sample. This identifies softening, stabilisation, crystallisation, glass transitions, melting and other phase changes.
DTA: Identifies the thermal signature of events by comparing the temperature of the sample to a reference. Identification of exo/endotherms, glass transitions and melting events gathers more information on the events seen with impedance.
Thermal Techniques
The DTA analysis technique is a close cousin of modulated differential scanning calorimetry (mDSC), the crucial difference being the source of the difference between the sample and reference. In DTA analysis, the heat flow is kept constant and the temperature measured, while in mDSC the heat flow is recorded while temperature is constantly compensated for to keep it at the same heating rate. The mDSC is one of the most sensitive techniques in frozen state solution analysis, and yet wasn’t designed for it – merely adapted. By targeting the frozen state with the novel impedance technique, the Lyotherm can show far more about a solution than even mDSC. A few of these comparisons will be drawn below, showcasing the power of the Lyotherm.
Isothermal Glass Transitions
One of the major advantages of the Lyotherm is the increased sensitivity to minor reorientations and thus glass transitions. The small ‘kink’ in the diagram at circa 30°C is indicative of this phase transformation. These are often very difficult to see in the mDSC due to their tiny heat flow signatures, as the DTA curve below also demonstrates – the line shows no sign of the associated thermal transfer that may be expected with this event due to its magnitude.
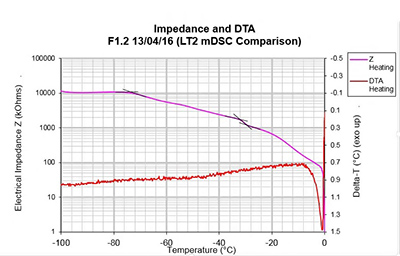
Figure 1: F1.2 Lyotherm 3 Analysis
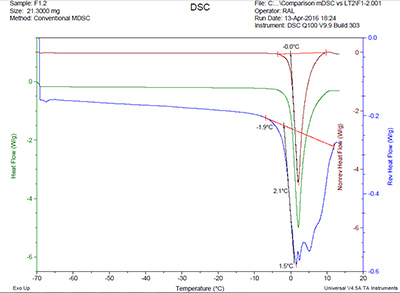
Figure 2: F1.2 mDSC
In mDSC (Figure 2) there is no sign of the glass transition with this sample. The midpoint version of the analytical method traditionally used in mDSC (especially with glass transitions) is dependent on how vigorous the exothermic / endothermic change is, as the heat evolved will directly contribute to the size and spread of the event. For this reason DTA and Impedance strictly use onset as a conservative estimate of the point the phase transition occurs at.
Layers of Information
The Lyotherm’s extra dimension of analysis can be seen in this sample, with an event visible in both mDSC and Lyotherm having a greater volume of information in the latter. The Lyotherm shows two events (Figure 3): the onset of an exothermic event (in DTA) that is linked to a small stabilization in the impedance curve at -67.3°C. The second event is a softening from -53.0°C to -30.4°C that results in maximum mobility in the sample. This mobility increase then triggers a slow melting process, seen again in the DTA curve.
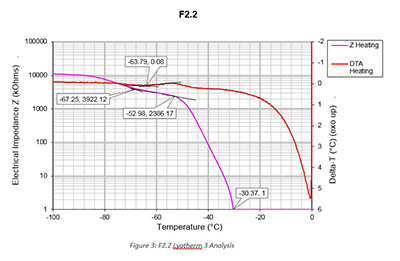
Figure 3: F2.2 Lyotherm 3 analysis
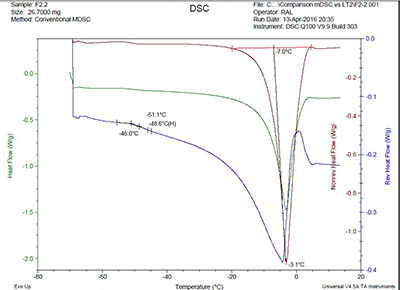
Figure 4: F2.2 mDSC Analysis
In the mDSC (Figure 4) the analysis of this event would be very different due to the lack of impedance data. The onset of slow melt (-51.1°C) correlates well with the -53.0°C seen in the Lyotherm data but doesn’t distinguish one element fully mobilizing in the solution as can be seen in impedance. The signal may also be confused with the very shallow exotherm in the non-reversible heat flow curve which occurs at a similar point to that seen in DTA, without the critical inclusion of the impedance data that shows it is related to a preceding stabilization event and shouldn’t be associated with the slow melt.
From the Lyotherm analysis we can see that this is precisely the event to be cautious of, as the onset of softening and finally maximum mobility, can be seen to start with it. During annealing this upper level of mobility (-30.4C) is the critical temperature to hold over to allow for the Ostwald ripening of the ice crystals potentially raising the critical temperature.
Corroborated and Superceded
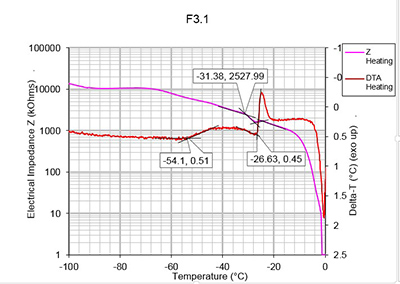
Figure 5: F3.1 Lyotherm Analysis
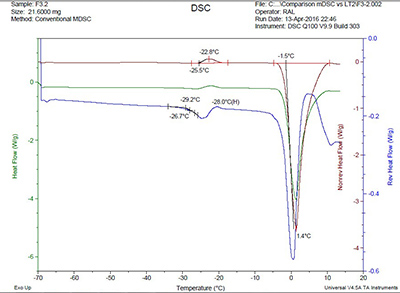
Figure 6: F3.2 mDSC Analysis
In the Lyotherm this sample also behaves in a complex manner but a key difference is the slope of the Zsinφ line before and after the transition, the gradient of which changes slightly. This suggests that the event is a glass transition which alters the heat capacity and thus the rate of softening in the structure. The onset of the event is -31.4°C which correlates closely to the onset given by mDSC (Figure 6). The exothermic event begins at -26.6°C which also agrees with the mDSC exotherm shown. The mDSC fails to pick up on the preceding exotherm with an onset of -54.1°C, which also doesn’t have a detectable effect on the Zsinφ graph. Since the DTA reaches a new baseline post-event it is possible that the onset at -53.4°C is the beginning of a new baseline due to a very minor enthalpic relaxation which isn’t seen in mDSC.
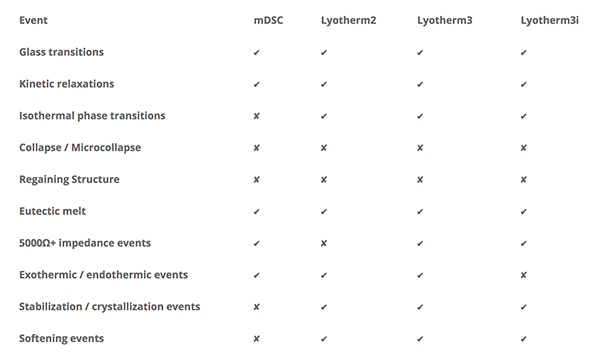
The Next Generation in Analysis: Lyotherm3
The new Lyotherm3 has been developed specifically to meet the analysis challenges that those working with analytical data for frozen state solutions encounter including the need for a higher impedance ceiling for early transitions in particular. The following table explains the analytical improvements offered by the Lyotherm3; an optional impedance only set-up will be available soon.
The major Lyotherm3 benefits are to be found in the user experience, such as a new enclosure design that allows for easier verification of status. Operation is now much easier with no need for raising and lowering the block, and cabling has been bundled into a simpler set up for corrective action.
New MS Excel export considerations allow for easier and more accurate analysis of the data, and additional improvements will be added in a modular format soon, allowing current users to quickly and easily upgrade their instrument.
Conclusion
The above studies give an illustration of the various aspects of the relationship between the Lyotherm and mDSC in frozen state solution analysis. Softening and isothermal phase transitions, or those with very minor thermal footprint, are by their nature difficult to see with thermal techniques. However, most phase transitions are accompanied by a shift in molecular mobility, often due to physical or chemical reorientations that generate large swings in one or more of inductance, capacitance and resistance in the solution.
The Lyotherm often finds the same, or more, events in complex solutions, and often identifies more information to give a better profile of those events than can be seen in mDSC due to the collaboration of electrical and thermal techniques. While this doesn’t guarantee a perfect-knowledge analytical technique, as can be seen in Figure 5, the more information, the better interpretation can be made of the events recoded. Whilst the analytical power of the mDSC is significant and applicable in dry or liquid samples, for frozen solid state it misses many changes due to the high heat capacity of water masking the events. A far more accurate and analytically sensitive approach that adds to the capability of the mDSC, is that of impedance, which when combined with DTA (a relative of mDSC) provides a much larger analytical throughput per sample. DTA helps corroborate and further identify transitions seen in Impedance Analysis and vice versa, synergising the ability to use both electrical and thermal techniques for the same purpose.