
A tablet is the product of the right marriage between pharmaceutical materials and manufacturing conditions. Proper pharmaceutical blend properties are a major contributor of this success. Though pharmaceutical tablets have enjoyed their place on the pharmacy shelves for centuries, their development is prevalently based on trial and error instead of a robust scientific approach. This is especially true with smaller pharmaceutical organisations having limited R&D budgets.
Tablet formulations can suffer several production issues before their successful entry into the market. One common late development issue is sticking, where formulation blends stick to the punches. This issue is primarily noticed during the large production cycles. Tablet sticking is an outcome of improper blend properties and poor tooling health of the tablet press. Natoli Scientific has established new and unique procedures to predict the formulation’s tendency for sticking along with recommendations for the right steel type to reduce its likelihood.
Powder rheological parameters
A powder rheometer could shed an important light on the basic reasons behind the tablet sticking. A shear cell test (USP/NF<1063>) is efficiently performed with FT41. This test measures the sticking’s key players, such as the adhesive and cohesive properties of pharmaceutical blends. The tablet sticking phenomenon depends on whether the adhesive forces between powder particles of the tablet and the punch tip surface exceed the cohesive forces between powder particles in the tablet. Therefore, primary powder rheological parameters derived from Mohr’s circle (Equation 1) could serve as a first tool to address the sticking issues associated with material properties.
In this equation, Ƭ is the critical shear stress, C is the powder cohesion, σ is the normal stress, and is powder’s effective angle of internal friction. Internal friction is the friction within powder after internal shearing.
The wall friction angle (Ф) is also determined with a shear cell test. The powder under normal load slides (shears) across the coupons representing the surface of a punch. The wall friction angle can also be expressed in degrees. It is obtained from the wall yield locus plot (Ƭ vs σ) passing through the origin (Equation 2). The wall friction is the tangential angle between shear stress and normal stress (Equation 3). This angle represents the friction of powder with the punch surface.
A unitless sticking index parameter is computed from the ratio of the wall friction angle to the powder’s effective angle of internal friction2,3. The parameter represents adhesive forces between pharmaceutical blend and the punch surface.
Experimental design
A 23 full factorial design with four center points was applied to evaluate the sticking index of a model ibuprofen formulation with different coupons representing the punch surfaces (Table 1). The X variables were lubricant types (hydrophilic: sodium stearyl fumarate [SSF]; hydrophobic: magnesium stearate [MgSt]), coupon types (S7 and hard chrome [HCr]), and lubricant amount (0.5%, 1.0%, and 1.5% w/w). S7 is the steel type and HCr is the Natoli standard chrome plating on the tool (Figure 1). Under these 12 experimental conditions, FT4 was used to measure the powder’s internal angle of friction and the angle of wall friction. Finally, the sticking index was computed from the ratios of measured internal angle of friction and angle of wall friction. The sticking index was considered a Y-variable.
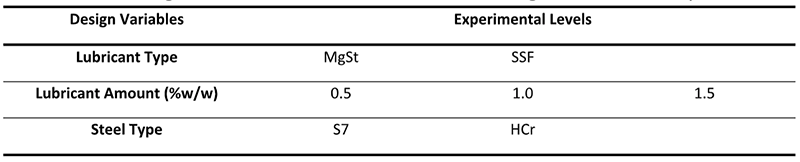
Table 1: Design variable levels in the 23 – full factorial design with four centre points
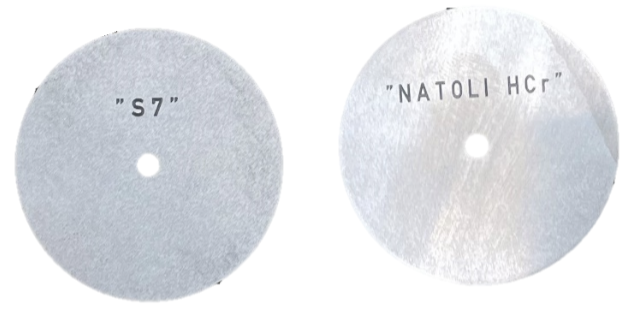
Figure 1: S7 and HCr metal coupon used for a wall friction test
Data analysis
Multivariate statistical analysis such as qualitative principal component analysis (PCA) and quantitative principal component regression (PCR) analysis were used to evaluate the data set (Unscrambler® v10, CAMO, Trondheim, Norway). A qualitative PCA decodes hidden data patterns. The PCA score plot provides information about the sample grouping, similarities, and differences. The PCA loading plot demonstrates factors responsible for identified patterns in the PCA score plot. The samples and variables located along the same side of the principal component (PC) axis exhibit a positive correlation and vice-a-versa. Therefore, a simultaneous analysis of these plots is important to understand the experimental findings. A quantitative PCR is used to quantify statistically significant and insignificant contributions of various X-variables, their interactions, and square effects on the single Y-variable. The X and Y variables were initially weighted by dividing the standard deviation before each modelling to give equal weighting to each variable. Two category variables, lubricant type and coupon type, were coded as split-category variables to separate out their individual contribution on the Y variable. The models were validated with full cross-validation and the Jack-Knife method.
Important findings of the study
A separate grouping of HCr and S7 coupons and their respective rheological properties along the PC1 axis in the PCA score and loading plots suggest their different sticking tendencies (Figure 2). The rheological properties, such as angle of wall fraction and sticking index, are positively correlated with S7 coupons and MgSt lubricated formulations along the PC1 axis. These properties are negatively correlated with HCr coated coupons and formulations lubricated with SSF. This indicates that S7 punches and hydrophobic lubricant might pose more sticking issues than HCr coated punches and formulations lubricated with hydrophilic lubricant. Another important variable is that the lubricant amount is negatively correlated with the angle of internal friction, angle of wall friction, and sticking index along the PC2 axis. This is in accordance with the knowledge that the addition of lubricant up to a certain critical amount helps reduction in the sticking.
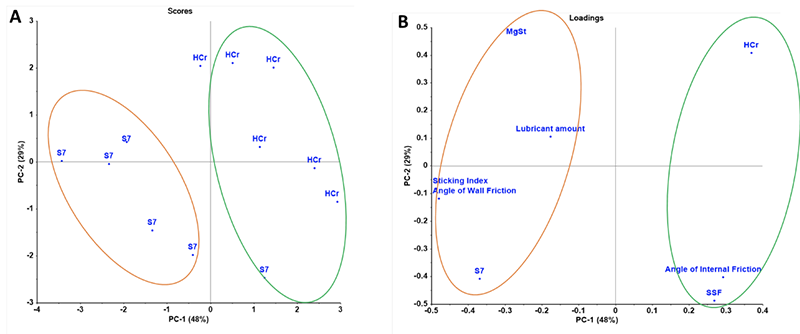
Figure 2: Principal Component Analysis (PCA): A) Score Plot and B) Loading Plot. The first two PCs explained 77% variance in the data set. Five PCs were required to explain the 100% variance
These qualitative findings were quantified with PCR (Figure 3; α = 0.05). Variables with a 95% confidence interval passing through the zero line are statistically insignificant. The sign and magnitude of coefficient bars of statistically significant variables indicate their impact in the Y- variables. Insignificant statistical interactions and the square effects are taken out of the model until model R2 values improve during the model optimisation operation. The statistical significance of the model was determined at p<0.05. The model was optimised with four PCs. The root mean square error (RMSE) at calibration and validation stages were 0.9051 and 0.7582, respectively. The impact of MgSt, SSF, and the lubricant amount in the present study was statistically insignificant. This might be due to the selection of narrow experimental ranges in the present study.
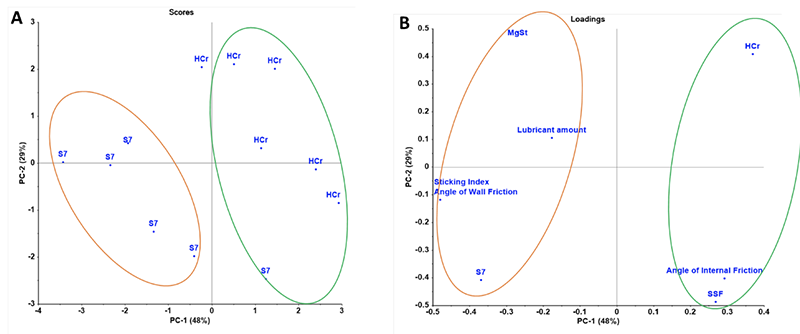
Figure 3: PCR coefficient plot quantifying the impact of X-variables on tablet sticking index (α=0.05)
A statistical significant shows positive and negative impacts of S7 and HCr on the sticking index, confirming that this ibuprofen formulation compressed with a HCr-coated punches will pose less sticking risk compared to S7 punches. The angle of internal friction and angle of wall friction show a significantly negative and positive impact on the sticking index. This insinuates that a reduction in the internal powder friction and material friction with punch surface significantly reduces sticking issues during the actual production cycle.
Take home message
The authors are aware that these finding are based on a limited data set generated with a single API model formulation. Regardless of these limitations, the present study was able to decode and quantify statistically significant impacts of various rheological properties of pharmaceutical materials on the possible sticking issues. Therefore, an early placement of these rheological tests in the pre-formulation studies could help select the right type and amount of lubricant in the formulation, and, if necessary, the desired coating for punches.
References
- United States Pharmacopeia (2022). General Chapter, (1063) Shear Cell Methodology for Powder Flow Testing. USP-NF. Rockville, MD: United States Pharmacopeia.
- Nakamura S., Otsuka N., Yoshino Y., Sakamoto T., Yuasa H. Predicting the Occurrence of Sticking during Tablet Production by Shear Testing of a Pharmaceutical Powder. Chemical Pharmaceutical Bulletin (Tokyo). 2016;64(5):512-6. doi: 10.1248/cpb.c15-00992. PMID: 27150485.
- Patel, D. B., and Dave, R. H. (2021). Predicting lubricants effect on tablet sticking using ketoprofen as model drug and evaluating sticking propensity using different metals and powder rheology. International Journal of Pharmaceutics, 606, 120913. https://doi.org/10.1016/j.ijpharm.2021.120913.


