Merck Millipore has new software for visualising GPCR and kinase activity
The Life Science division of Merck KGaA, Merck Millipore has introduced a software application for visualising GPCR (G-protein coupled receptors), as well as kinase activity.
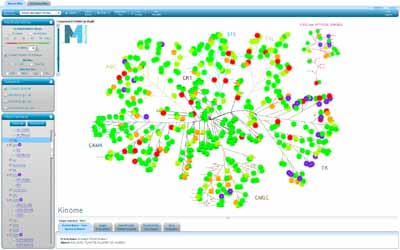
The new Data Analysis and Report Tool (DART) creates an interactive map of target profiling assay results and enables drug researchers to make faster, more informed decisions.
‘Lead profiling often requires sifting through hundreds or even thousands of data points to pinpoint targets for further optimization studies,’ said Paul Wilhite, senior manager of eBusiness at Merck Millipore. ‘This new online tool provides a unique, information-rich interface so scientists can rapidly narrow their research and effectively collaborate with colleagues.’
The application projects each compound's activity profile onto a map depicting clusters of target protein families. This map provides scientists with immediate graphical insight into cross-target interactions to help drive structure-activity relationship (SAR) studies. The application is fully customisable. Data limits, sizing, colours, and target subclasses can be adjusted in seconds, thereby turning numerical data into a graphical display that can highlight biologically significant conclusions. Additionally, selected target information is dynamically populated and includes the gene symbol and aliases; links to bioinformatics content and recent publications; as well as links to appropriate Merck Millipore products.
Users of Merck Millipore's KinaseProfiler and GPCRProfiler screening services can upload their data directly into the DART tool or enter other datasets manually to take advantage of the software's analytical power and presentation-quality images.