Amorphous solid dispersions (ASDs) are used to increase the oral bioavailability of poorly water-soluble drugs through the formation of a high energy amorphous glass.1,2 Amorphous formulations provide enhanced dissolved drug concentrations compared with the crystalline form.
For this reason, ASDs have become an important formulation approach for biopharmaceutical classification system (BCS) class 2 and 4 solubility limited compounds.
Spray drying is one of the most widespread technologies used to generate ASDs.3,4 The spray drying process consists of atomising a solution of drug and excipients in a chamber with the appropriate temperature and flow of drying gas to produce solid particles, which are typically collected by cyclone for further processing.
The spray dried dispersion (SDD) intermediate can then be incorporated into a range of dosage forms, including granules in capsules, IR-tablets, CR/MR tablets and minitabs. SDDs have the advantage of particle size control to ensure fast and reliable dissolution, good physical stability when formulated with high glass transition (Tg) polymers and well-understood scalability.
Modelling tools can help to simulate the drying process and the interaction between the elements of the SDD, potentially allowing for lower risk and shorter development timelines to clinic and to market.
Solvent selection: a critical step in spray drying process development
Solvent selection is a critical step in the manufacture of SDDs and can have important implications for processability, stability and performance. Solvents are generally chosen to achieve high process throughput, which is impacted by solution viscosity, solvent vapour pressure, heat of vaporisation and API/excipient solubility in the spray solvent.
As the spray drying process removes solvent very quickly (approximately 1 s), it is often assumed that one can kinetically trap a homogenous amorphous dispersion by spray drying despite the transient immiscibility of components during drying or the immiscibility of the drug and polymer in the final particle.
Indeed, it is typically the case that kinetically stabilised single phase SDDs are produced using thermodynamically immiscible API/polymer compositions.
In recent years, many drug pipelines have included a larger proportion of high melting point “brick dust” APIs that are poorly soluble in preferred spray drying solvents. The drug Dasatinib, for example, exhibits only slight solubility in acetone, methanol and dichloromethane, all of which are preferred solvents for spray drying because of their volatility and relatively low heats of vaporisation.
Limited spray solution solubility has immediate implications for process development and scale-up, including larger liquid preparation volumes, slower solution feed rates into the dryer and prolonged run times per batch.
The prevalence of brick dust compounds has driven the use of mixed solvent systems to maximise API solubility and thereby improve process throughput.
For example, Figure 1 shows that the solubility of one model compound, Ritonavir, can be increased by approximately 95% in a 90/10 acetone/water solvent system compared with acetone alone, allowing for a dramatic increase in spray solution solids loading.
Throughput is penalised, however, by the less optimal thermodynamic properties of the mixed solvent system (higher heat of vaporisation), which reduces the liquid feed rate to the dryer. In this example, the improved solubility outweighs the solvent system’s thermodynamic impacts, resulting in a 35% reduction in spray time per batch.
For extremely low solubility compounds, such as those with less than 1 wt% solubility, such improvements can be a decisive factor in assessing the feasibility of scale-up.
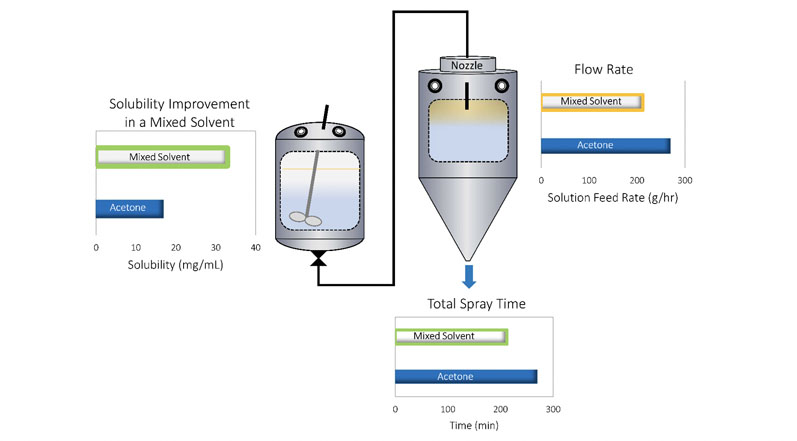
Figure 1: Use of a mixed solvent system to optimise spray solution solubility of the API and process throughput
Spray drying from a mixed solvent system results in a changing composition as the droplets progress towards the solid state owing to unequal evaporation rates of the two solvents (with the exception of azeotropes). The change in solvent composition may increase the risk of API phase separation during drying owing to the enrichment of poor solvents, such as water.
Tools are needed to improve our understanding of the interplay between drying kinetics, compositional changes and phase behaviour in the spray drying process.
Below, we describe a modelling tool that simulates the drying process and API solubility in a single droplet. This tool allows a rational assessment of the balance between physical stability risks during drying against process throughput improvements imparted by a mixed solvent system during SDD formulation development.
Model based risk assessment and development acceleration
The utility of the drying model was shown using Ritonavir (RTV)/PVPVA sprayed using a methanol/water mixture. In this case, pure methanol is a good solvent for RTV, whereas pure water is a poor one.
This is also a system in which the solubility of RTV is enhanced at low concentrations of water in methanol, exemplifying the solubility advantage imparted by a mixed solvent system.
Although this system is a somewhat artificial example — RTV exhibits adequate solubility in pure methanol and therefore doesn’t require mixed solvents — we use it here as a model to demonstrate the impact of the differential evaporation rates of methanol and water, which results in phase separation during drying.
This phenomenon is exemplified in Figure 2 in which modulated DSC data shows the impacts of the solvent composition of the initial spray solution on the phase homogeneity of the RTV/PVPVA ASD.
The reversing scans of the DSC traces show broadening and eventual separation of the RTV/PVPVA Tg into two distinct transitions, indicative of amorphous phase separation of drug-rich RTV domains from the ASD.
The non-reversing scans show the additional enthalpic overshoot of the drug-rich phase. This phenomenon will exist in many mixed spray solvent formulations involving solvents of differing volatility, raising important questions about using such mixtures:
- What starting spray solution solvent compositions are thermodynamically “safe” to ensure a single phase ASD?
- How sensitive will a particular spray solution formulation be to mixed solvent composition?
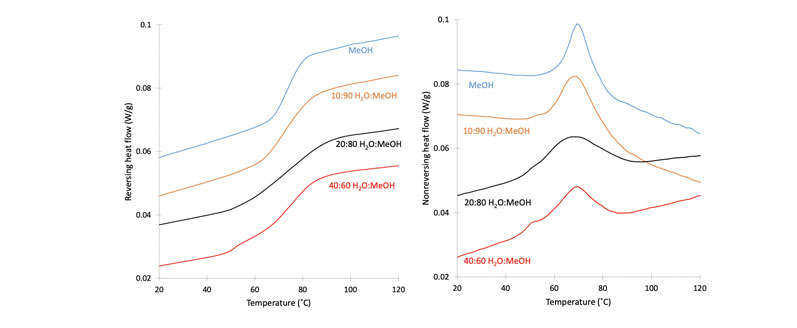
Figure 2: Modulated DSC scans of the ritonavir/PVP-VA system sprayed using solvent systems with varying methanol/water ratios
Early assessment of these questions can minimise resource-intensive spray drying trials and the associated analytical work during process development. A combined thermodynamic and kinetic model for droplet drying can partly fill this gap by providing answers to the above questions, helping to predict failure edges during solvent selection.5
Figure 3 shows the construction of one such model based on the instantaneous composition of the drying droplet for RTV/PVP-VA/methanol/water to illustrate the utility of this simulation approach in solvent selection.
The drying/thermodynamic model is divided into two parts. The first describes the kinetic aspects of droplet drying in a four-component system consisting of up to two volatile solvents and two non-volatile components (dispersion polymer and API, for example).
The drying model consists of a spherical geometry that is discretised into radial volume elements. Mass transport through the droplet and at its surface are given by ordinary differential equations describing diffusive and convective transport between adjacent volume elements and evaporative mass flux at the surface of the droplet.
Heat and mass transport are coupled together via evaporative cooling at the droplet surface. The thermodynamic part of the model uses a quaternary Flory-Huggins free energy calculation to provide estimates of amorphous phase boundaries.
The six interaction parameters are estimated from dynamic vapour sorption data. We note that the driving force for crystallising systems can be accounted for in the calculations, but is not done here as RTV is not prone to crystallisation in this particular formulation.
Figure 3 shows the overall drying trajectories for the RTV/PVP-VA/methanol/water system provided by the simulation in four-component compositional space, represented here by the tetrahedral diagram. Maximum solubility of the API in the spray solvent is achieved at 85/15 MeOH/H2O, but this leads to water enrichment and potential RTV supersaturation.
A primary question is how high a starting ratio of MeOH/H2O is possible before this becomes an issue. Increasing the initial water content of the solvent causes the drying composition to take an arced path through the compositional space owing to the differential evaporation rates of water and methanol.
Methanol dries faster because of its faster diffusion coefficient at the gas/liquid interface and lower heat of vaporisation, resulting in a higher evaporative mass flux than water. As drying proceeds, the trajectories show a more water-enriched composition — the extent of which depends on the total starting water content of the solvent.
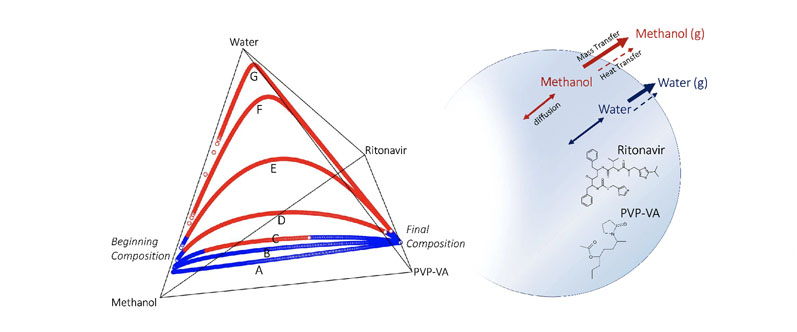
Figure 3: Quaternary diagram tracking the composition of RTV/PVPVA/methanol/water droplets during drying: curves A to G correspond to 90/10, 88.5/11.5, 87.5/12.5, 85/15, 80/20, 70/30 and 50/50 MeOH to H2O ratios in the solvent phase of the starting spray solution; the blue portions of the curves indicate API below saturation; the red portions of the curves indicate that the API is in a supersaturated state
The drying composition diagram also illustrates when we expect RTV to become supersaturated, and importantly, the portion of the drying trajectory during which the droplet is predicted to be in a supersaturated state.
The lowest water content trajectories, 95/5 and 90/10 MeOH/H2O, both largely avoid supersaturation during drying by keeping the RTV concentration below saturation throughout the entire drying trajectory.
But, as the trajectories in Figure 3 and extracted pseudoternary diagrams in Figure 4 show, higher water contents produce trajectories that either skim or pass deeply into the supersaturated region.
In this system, there is a sharp boundary between water contents that pass through thermodynamically supersaturated states, allowing a clear rank ordering of behaviours: 95/5 and 90/10 = safe; 88.5/11.5 = some risk; and <85/15 = phase separation.
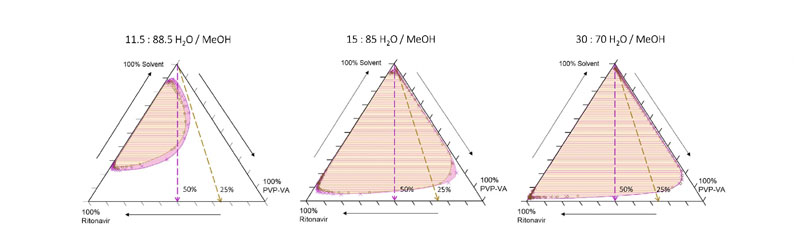
Figure 4: Extracted pseudoternary phase diagrams derived from quaternary compositional trajectories illustrated in Figure 3 for three different starting solvent compositions: dashed lines indicate trajectories for 25% and 50% drug/polymer compositions; the superimposed salmon and pink shaded regions represent phase boundaries calculated for the 25% and 50% API loaded trajectories, respectively
These predictions are experimentally verified by the DSC measurements of amorphous phase separation in this system, showing that the onset of phase separation in the experimental system begins at about a 90/10 MeOH/H2O solvent content, and becomes worse as water content of the spray solution is increased.
In this case, the model very closely predicts the boundary for phase separation (88.5/11.5 in simulation versus 90/10 by experiment). These simulations allow an assessment of the most likely compositional regions in which failures will occur, so that formulators can reduce the size of compositional surveys and target compositions on the “safe side” of these phase boundaries as a starting point for further optimisation.
Conclusion
Modelling approaches, such as the one described here, stand to play an increasingly important role to help derisk spray solvent selection as the industry moves into increasingly challenging chemical spaces for many NCEs. These complex spray solution formulations may often require non-standard solvent systems to improve process throughput.
Indeed, as the simulations in this work have shown, unexpected issues in physical stability can arise in mixed solvent systems, even when the starting and ending composition exhibit single-phase behaviour.
Understanding when physical stability risks are present, and strategies for mitigation, will surely help to obtain right-first-time spray solution compositions and ensure the development and robust manufacture of new drug formulations.
References
- S. Baghel, et al., "Polymeric Amorphous Solid Dispersions: A Review of Amorphization, Crystallization, Stabilization, Solid-State Characterization and Aqueous Solubilization of Biopharmaceutical Classification System Class II Drugs," Journal of Pharmaceutical Sciences 105(9), 2527–2544 (2016).
- H.D. Williams, et al., "Strategies to Address Low Drug Solubility in Discovery and Development," Pharmacological Reviews 65(1), 315–499 (2013).
- D.E. Dobry, et al., "A Model-Based Methodology for Spray-Drying Process Development," Journal of Pharmaceutical Innovation 4(3), 133–142 (2009).
- D.T. Friesen, et al., "Hydroxypropyl Methylcellulose Acetate Succinate-Based Spray-Dried Dispersions: An Overview," Mol. Pharm. 5(6), 1003–1019 (2008).
- N. Li, et al., "Water-Induced Phase Separation of Spray-Dried Amorphous Solid Dispersions," Mol. Pharm. 17(10), 4004–4017 (2020).